In this very small project I learned how to get data from an arduino and visualize it using Processing .
A long time ago (about 2010), when I was an active part in ASAAF (amateur astronomers' association of Complutense University), we decided to start a program called 'GEMA chiefs' to involve undergraduate students to some form of research outside of the curriculum. The idea was to set some sort of "problem" related to astronomy, which would then need to be "solved" with the help of our fellow students.
One of such projects was called "Arduino4fireballs", and tried to automatise the recording of fireballs using an arduino .
Whenever you record fireballs using cameras, one typically needs a program that detects movement inside of the apparatus' field of vision. This method has an inconvenient, though: everytime another (noninteresting) moving object passes by, such as birds, planes, UFOs,..., the camera will be triggered.
This generates a lot of "garbage", especially during daytime, since most moving objects in conditions of diurnal illumination are enough to trigger the camera. However, sincefireballs are (in principle) observable in a several-hundred kilometre radius, it is possible to circumvent this problem by using several cameras located far apart and obtaining coincidences between triggering events.
The project, Arduino4fireballs, had a simple task: to produce an integrated system, based on arduino that could detect when a fireball was passing and were able to communicate with a central, master server, to decide whether the event seen was a fireball or not. If this device were fast enough, one could eliminate the noninteresting events by just recording the ones that generate coincidences. This project was part of a larger one, aimed at building an architecture to compare the observations between (at least) three different cameras to detect coincidences.
We did not finish the project (mainly due to the lack of time), but we ended up with a system that would acquire data from a photoresistor and was able to display the information live on the screen.
This system required a sketch to be uploaded to arduino (called sensor.pde [with comments in Spanish]), that would take the data from the photoresistor (SEN-09088) connected to an analog port as part of a current divider.
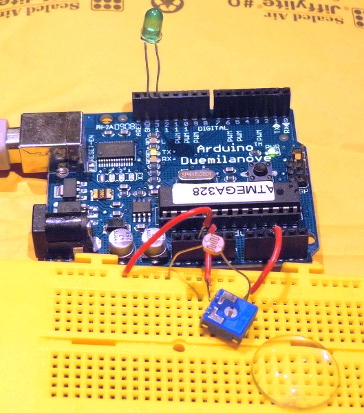
This data is sent via the serial port to the computer, where
a Processing sketch (called
proc_sensor.pde
) displays a plot of the data that updates in real time. Additionally,
we require a font file
(ArialMT-20.vlw
to be copied in the _data_ folder to show the labels in
the graph.
The following video is just a brief showcast done at home:
Go Top